hy do you need to analyze your blog’s statistics? There’s the curiosity factor of wanting to know how many visitors your blog is attracting, of course. But what is more important is what the analytical data tells you about your readers and how you can use it to improve your blog.
Installing Google Analytics
Let’s start with the basics, assuming you know nothing about Google Analytics. First, you need to set up a Gmail account. Having a Gmail account is a requirement to use Google Analytics as well as Feedburner and Google Reader.
For a beginner, signing up for Google Analytics can seem intimidating, but it is actually quite easy. Here’s how to sign up:
- Go to Google Analytics, and log in using your Gmail account.
- At the top right in the pull-down box next to My Analytics Account, pick Create New Account.
- Click on the Sign Up button.
- On the Analytics New Account Signup page enter:
- Website URL: enter your blog’s URL.
- Account name: enter the name of the blog.
- Time zone country or territory: enter your country.
- Time zone: enter your time zone.
- Click on Continue button.
- Enter your name, phone number, and country.
- Click on Continue button.
- Click on the “Yes, I agree to the above terms and conditions” button.
- Click on Create New Account.
- Add Tracking Code to the blog.
- When you create your new account, you will be taken to the Analytics Tracking Instructions page. You’ll need to get the New Tracking Code on to your blog. To do this, create a sidebar widget, and copy and paste the code into it. It is invisible, so your readers will not know it is there.
- Go back to Google Analytics, and click on Continue. Your account is fully set up.
Once Google Analytics recognizes that the tracking has been installed, the status will update to “Receiving Data” with a checkmark showing that you have successfully installed the code.
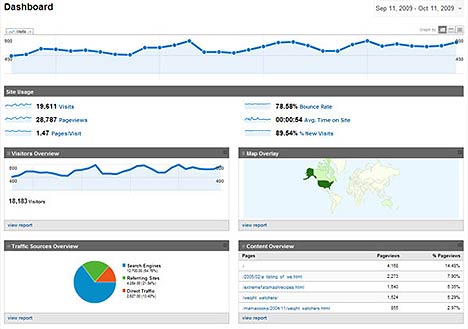
The Google Analytics Dashboard
The dashboard gives you an overview of your blog’s usage data: total visits, page views, pages per visit, time on site, bounce rate, and percent of new visitors within the past month. (You can change the date range by clicking on the date in the upper right-hand corner.) Other stats such as visitor overview, what countries your blog visitors are from, traffic source overview, and content overview are also provided.
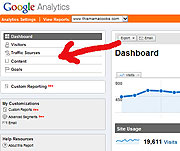
To drill down further into your stats, use the Dashboard box on the upper left-hand side. Click on Visitors, Traffic Sources, and Content.
Visitors: who is coming to your site and what are they doing there?
Map Overlay: this measures where in the world your readers are located. If you write in English, you will probably only attract readers from English speaking countries, but you will be surprised who is finding your blog from around the world.
New vs. Returning: this stat will help you determine if you are converting visitors into loyal readers. This is something to work on improving over time.
Visitor Trending: Bounce Rate and Average Page Views: these stats are related. Bounce rate measures how many visitors come to your site and then leave without viewing any extra pages—the lower the number the better. With average page views for all visits, you can see how many pages your visitors are viewing per session—the more pages the better. (You can also find similar page view data under Visitor Loyalty: Length of Visit and Depth of Visit.)

Since you want visitors to dig deeper into your work, you need to find ways to keep them on your site longer. One strategy is to break long posts into two sections or to do a series of linked posts. Another way is to mine your own content by linking to older but similar posts. The LinkWithin widget does something similar to this by showing related stories under each post.
Time On Site: the longer visitors stay, the longer they are reading and commenting. Shorter times spent on the site means they were looking for a bit of information and quickly leaving. (Another measure of this is Length of Visit under the Visitor Loyalty tab.) If you want to increase Time On Site, mine your content, write a series of related posts over a few days or weeks, or include video posts since many people like to watch content more than they like reading it.
Visitor Trending: Visits: what are your daily, weekly, and seasonal trends? What are the times of day or week that you see your strongest traffic? Are there times of the year where certain topics you write about like summer vacations or holiday recipes attract more readers? Use this information to help you decide the best time of day or week to publish a post and to write content that takes advantage of the seasonal trends.
Traffic Sources: how are people finding your site? Your Traffic Sources Overview gives you a quick look at where your readers are coming from. Is most of your traffic from search engines, referring sites, or coming directly to you?
Direct Traffic: this refers to readers who found you by typing in your URL in their browser or clicked a bookmark to come to your site.
Referring Sites: what sites are referring the most traffic to your blog? This is a great way to determine if using sites like StumbleUpon and Twitter help increase your traffic. It is also another way to see if guest posting at another blog has paid off.
Search Engines: if you have a low percentage of people coming to your blog from search engines, it may be because your blog is fairly new. However, if you have an established blog, you may not be getting the search engine traffic you deserve because you are not using search engine optimization (SEO) and are failing to use keywords (search terms) in your blog posts.
Another problem could be that your blog template is not as SEO friendly as you hoped. A good web or blog designer who is savvy about SEO can help clean up your code to improve your blog’s searchability.
Keywords: knowing what keywords people are typing into search engines to find your content can give you ideas for future posts. If you are getting a lot of traffic for “horror movie reviews,” write more of them!
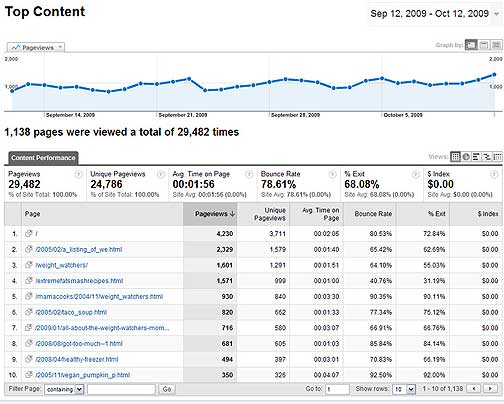
Content: what are your most popular posts?
Top Content and Top Content by Title: both of these show what posts are the most popular on your blog and what readers are spending the most time on (see Bounce Rate). Again, like other statistics in Google Analytics, this data should give you ideas for future content. If posts on saving money with coupons are popular, plan to revisit that subject in new ways again and again.
Other Blog Analytics Tools:
Feedburner RSS Stats: if you are using Feedburner to manage your RSS feed, not only does it give you data on the number of subscribers, but it also tells you what feed items are the most popular—another way to discover what content is engaging your readers.
Lijit: having a Lijit search widget gives you access to a quick overview on traffic stats. More importantly it shows what readers are looking for while they are on your blog.
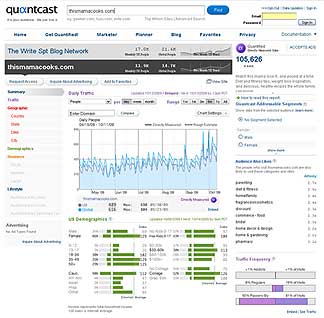
Quantcast: if you are asked by a potential advertiser about your readers, you need to install Quantcast on your blog. This free and easy to use service gives you stats on traffic, website rank, and reader demographics (age, gender, children per household, income level, college graduate status, and so on).
Affiliate programs: If you use an affiliate program like Amazon’s, your account should come with some type of reporting data. Look over the monthly, quarterly, and yearly stats to determine what your readers are buying.
By looking over the data, you should be able to determine the times of year your audience is doing the most shopping—usually around the holidays. If so, plan on creating special holiday themed posts that include affiliate links. You may want to create a special holiday gift guide section on your blog, too.
Do Not Be a Slave to Your Stats
The maddening thing about stats is that every analytics tool will give you different numbers since each has a slightly different way of counting things. Of course, the analytics tool that is giving you the best numbers will probably be your favorite one to use. No problem, since blog analytics can be more art than science at times.
Finally, if you are a blogging newbie, the temptation is to check your stats hourly. All that adds up to is wasted time. Instead, check your overall traffic stats once a day or a few times per week. In addition, you may want to dig deeper into your stats a few times per month to see what is working for you and what is not.
***

Anne-Marie Nichols is a Colorado-based work-at-home mom, blog wrangler, and social media consultant. When she is not blogging from a mom's perspective about food, weight loss, exercise, and health at her blogs This Mama Cooks! On a Diet and This Mama Cooks! Reviews, you can find her on Twitter @amnichols. She is also a social media manager at Mom Central Consulting and blogs for them at Mom Central Blogger University.